POWERED BY SPND · SPONSORUNITED
2026 FIFA World Cup
Sponsorship
Intelligence Report
Sponsorship spend for the 2026 FIFA World Cup reached an estimated $1.7 billion–$2.2 billion — before media, hospitality, and other FIFA events. Inside this report, discover the brands and categories that spent the most, as well as the asset mix that showed up in the deals.
ESTIMATED TOTAL SPONSORSHIP SPEND
$1.7B–$2.2B
Excludes media, hospitality & other FIFA events
PARENT BRANDS TRACKED
0
22 categories
AVERAGE PARENT BRAND SPEND
$49M–$63M
Rounded. Price points may vary to levels well outside this range depending on partnership level.
SPND for the 2026 FIFA World Cup approximates World Cup-specific brand spend on sponsorship assets. We acknowledge that many brands may have additional spend in hospitality and media during the World Cup, and/or other FIFA-related events outside the primary World Cup window. Those elements are not estimated in this dataset but can likely be part of larger FIFA-wide deals that include the World Cup and/or its affiliates.
What we learned
A blueprint for how brands should approach a global tentpole event.
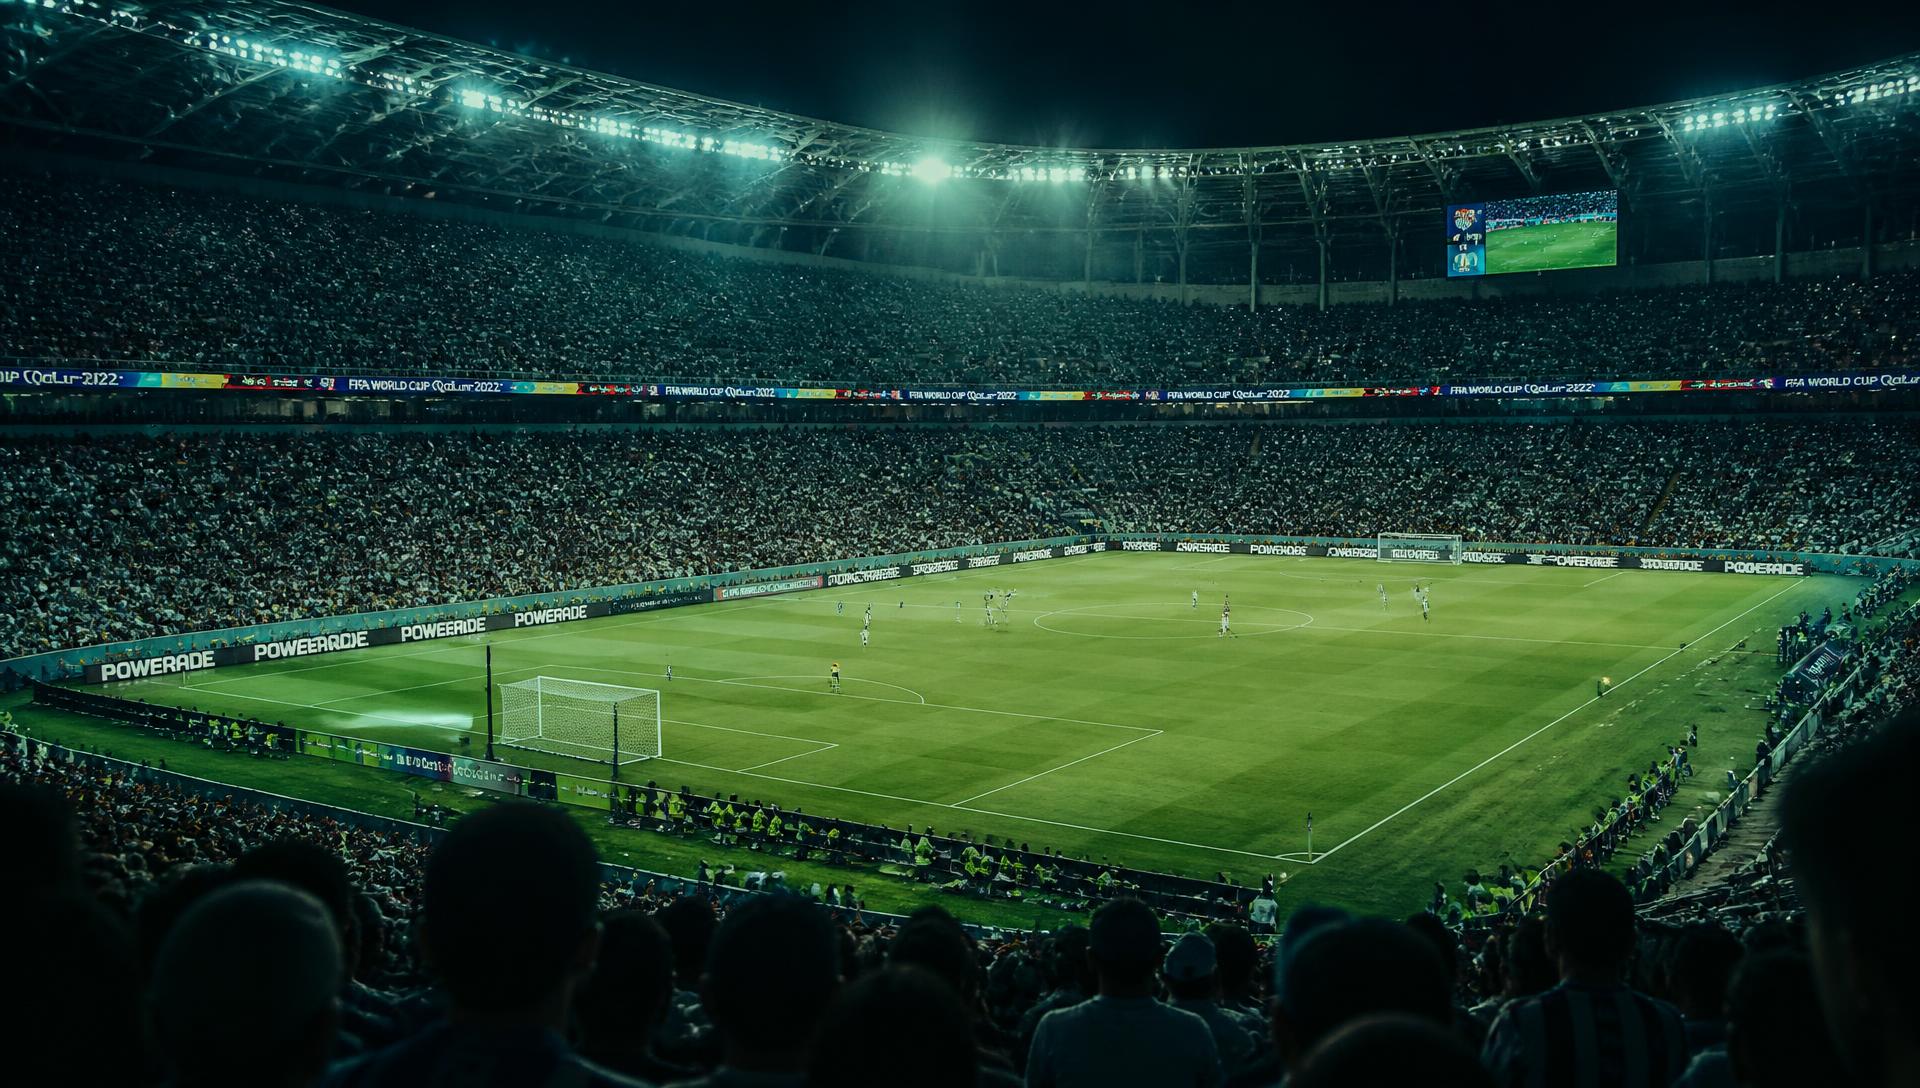
The 2026 World Cup was a masterclass in modern tentpole marketing. Brand investments pooled into a few high-value FIFA partnership categories, but the activations were distributed across dozens of on- and off-pitch touchpoints fans encounter before, during, and after the match. The result is a repeatable playbook brands can study for the next Olympics, Super Bowl, or World Cup cycle.
01
The biggest brands aren't rivals — they're different playbooks
The brands behind the World Cup's largest deals aren't all chasing the same thing. FIFA's partnership structure spans several tiers — global, category-exclusive, market-specific — so brands land among the biggest deals for very different reasons. The presence behind the dollar figure ranges from stadium signage to global campaign rights to fan-facing activations.
02
Investment is concentrated in certain categories; presence spreads everywhere
Financial services led all categories with a total category spend of $200–250M, and gaming and tech followed at $100–150M as total category spend. Newer categories like prediction markets now buy at the same table as legacy partners — and their presence shows up on and off the pitch.
03
Digital ads on Ground Level was the most-purchased asset
It was also one of the most expensive assets. The premium inventory sits with in-broadcast surfaces and press backdrops; outside the rate card, brands bought attention with referee sleeves, sideline ball holders, and the ball itself.
04
In without a true deal: there's a side door
Not every brand that showed up signed with FIFA. American Airlines captured high-impact tournament association through a targeted Official North American Airline Supplier designation alongside its U.S. Soccer partnership — airport activations, ambassador creative, and loyalty integrations instead of a premier global category sponsorship.
01 · Top spending brands
The brands behind the largest World Cup deals.
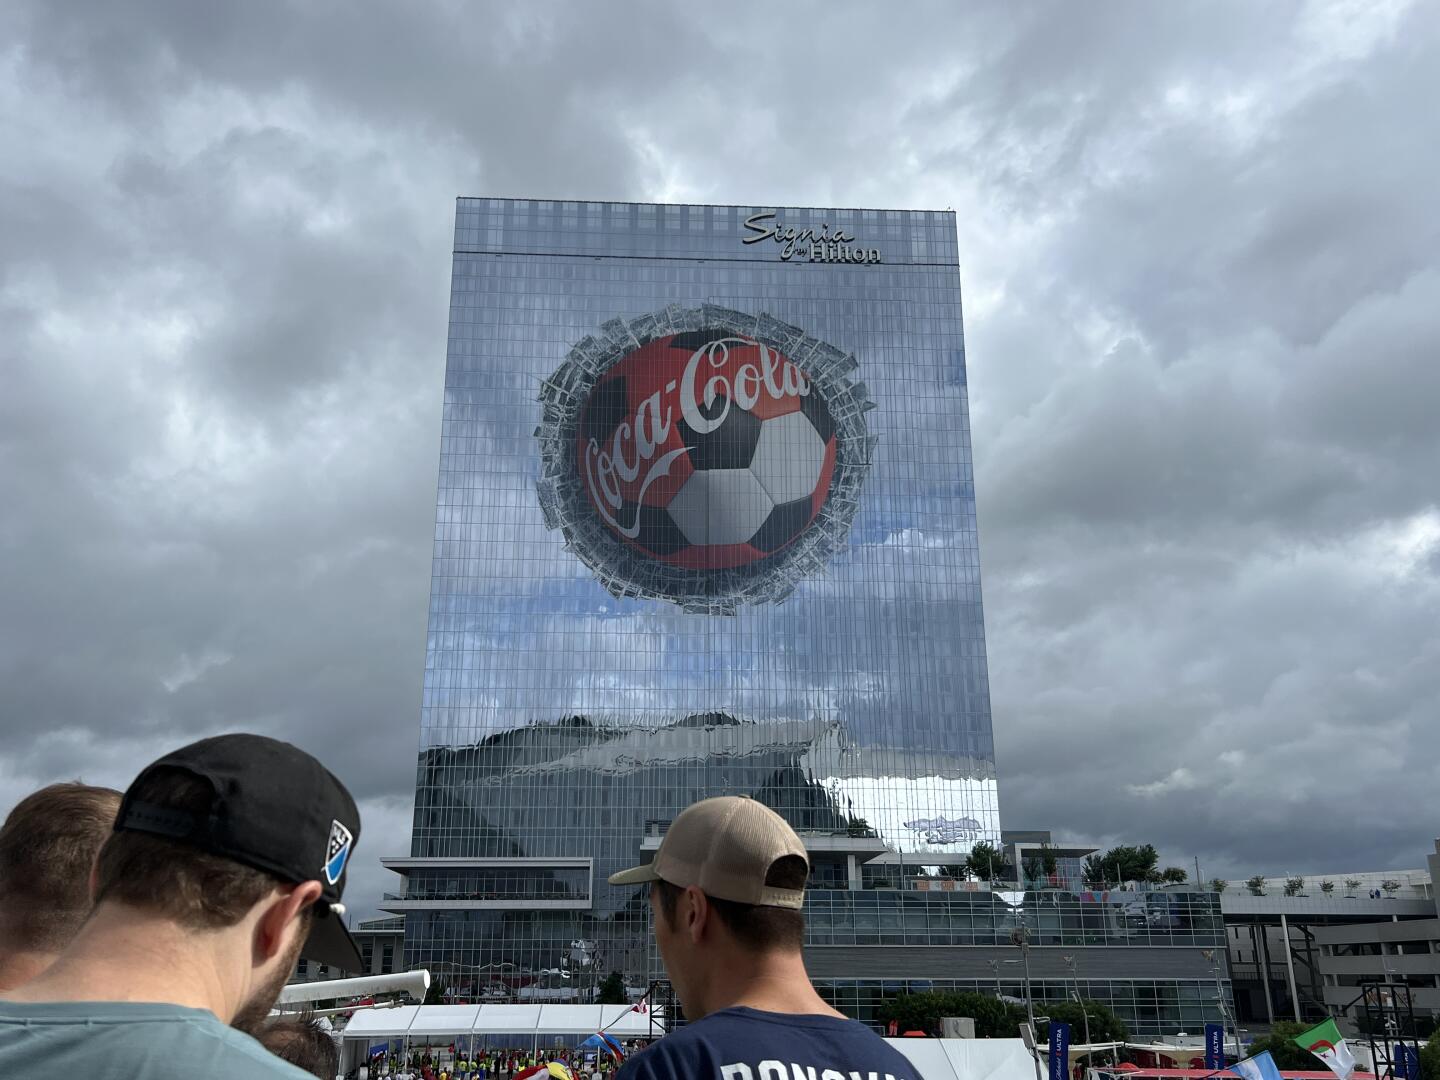
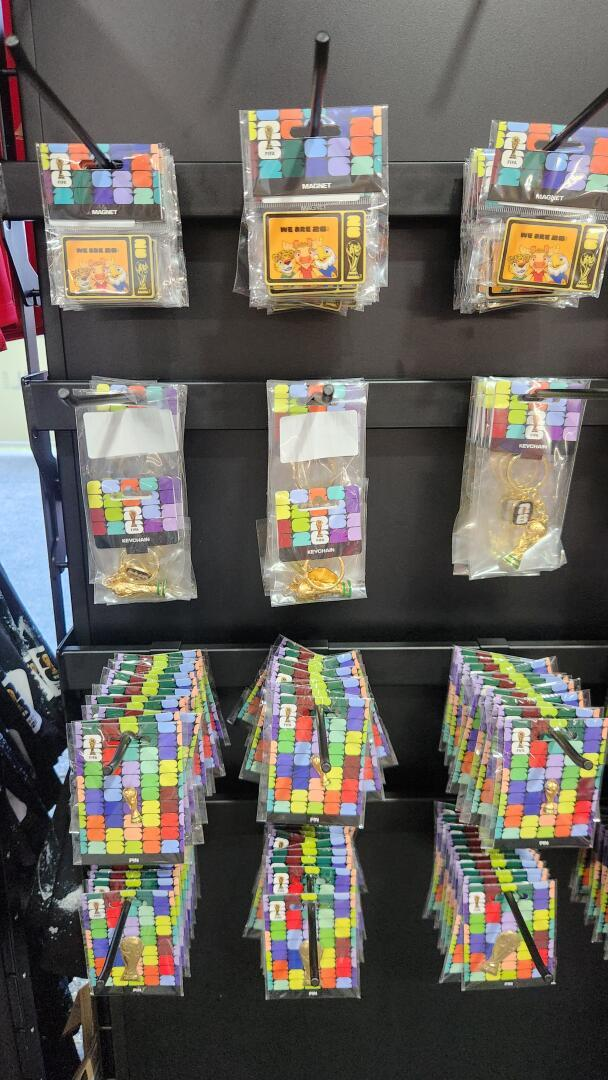
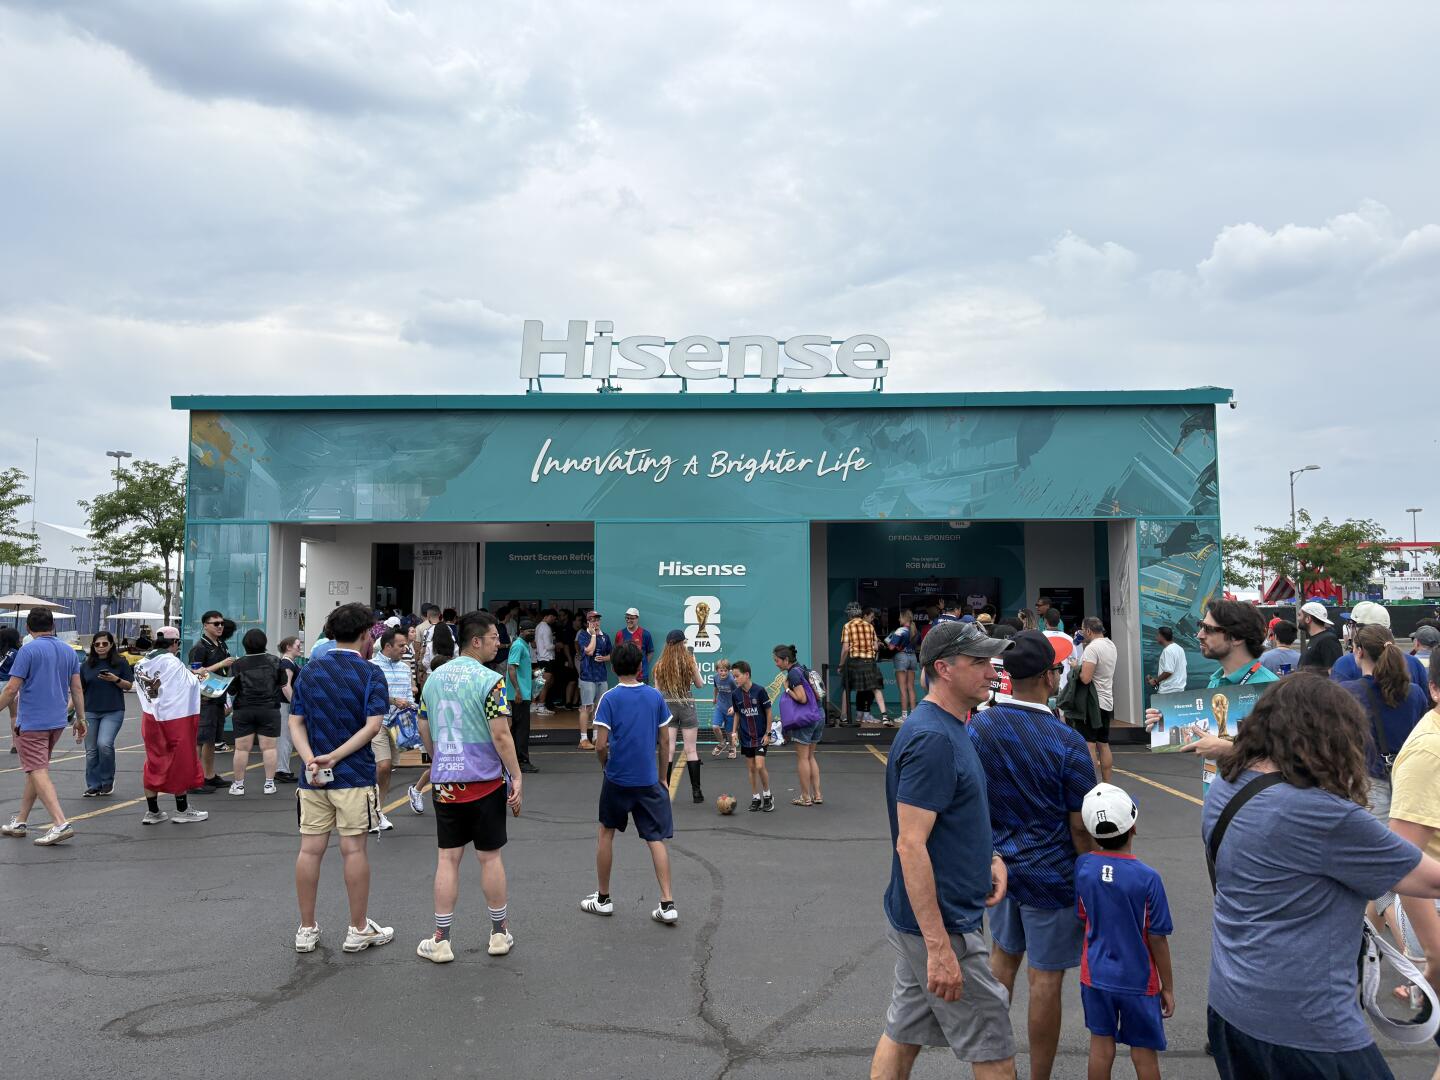
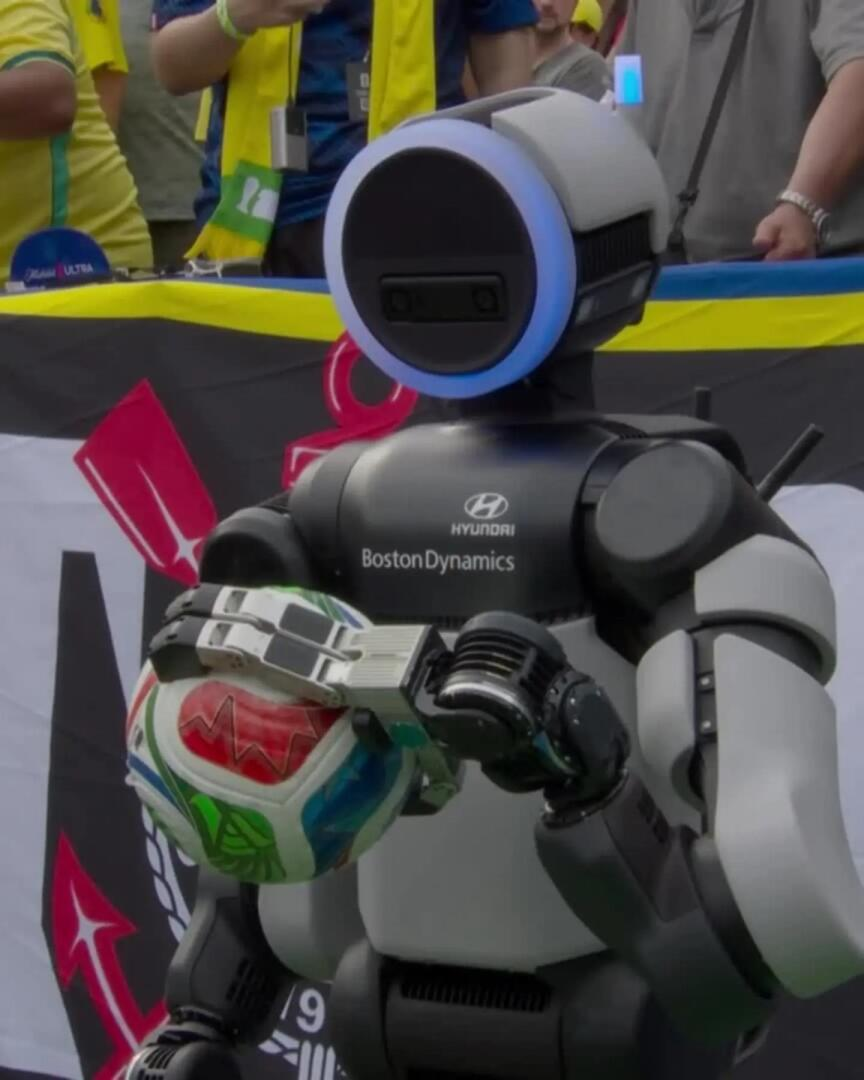
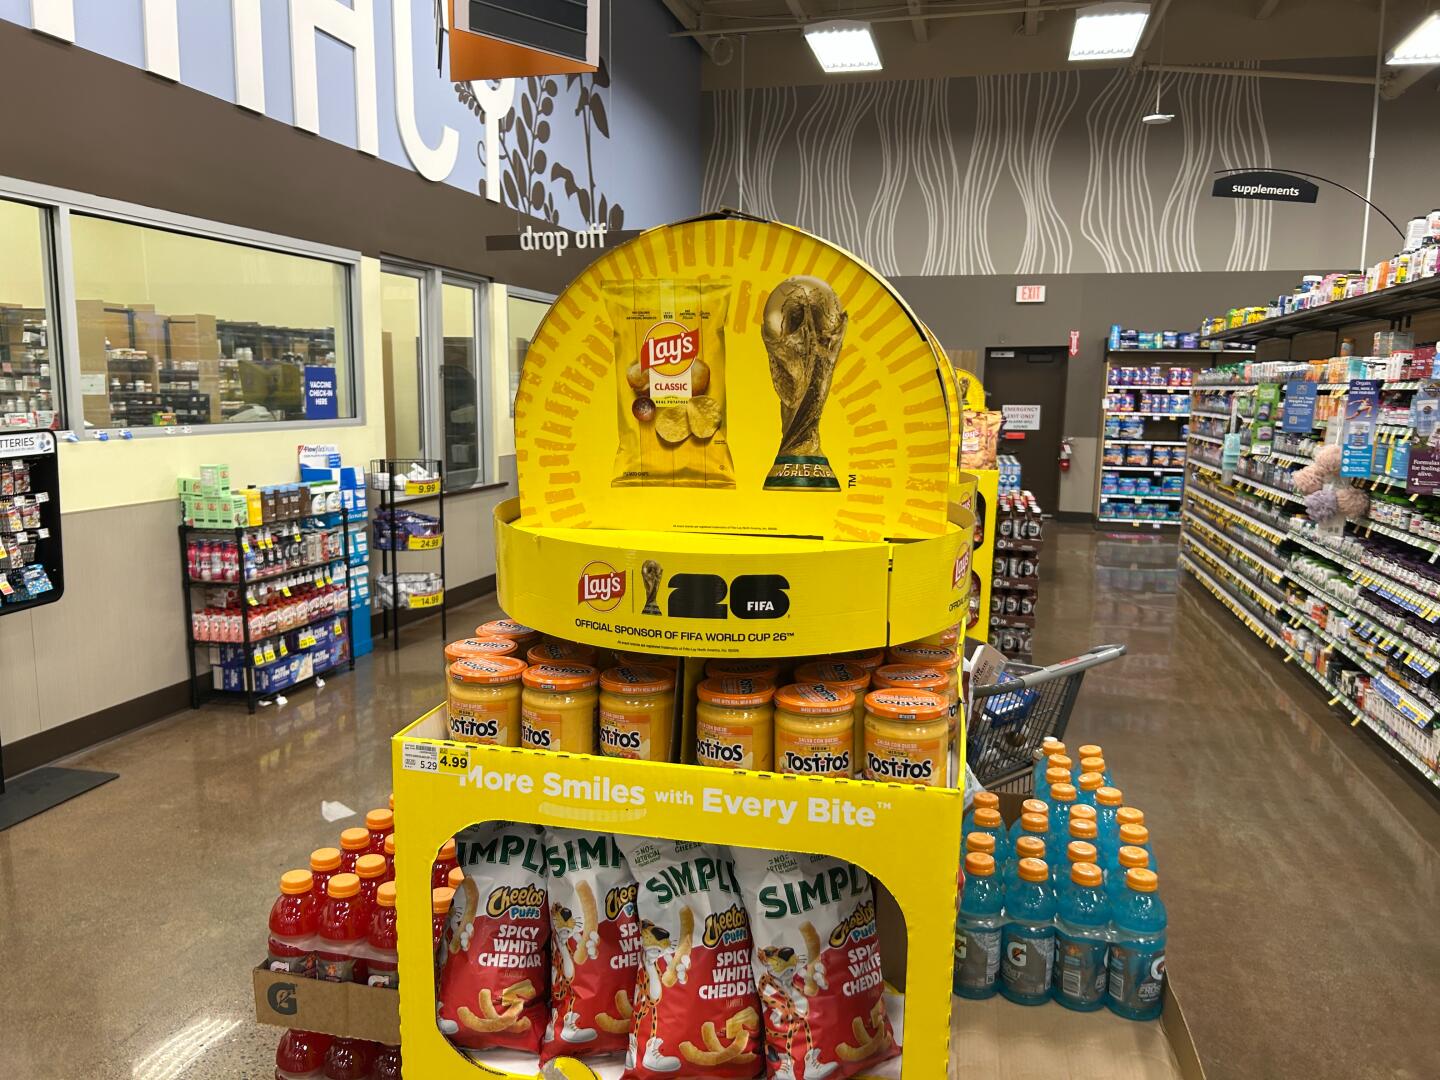
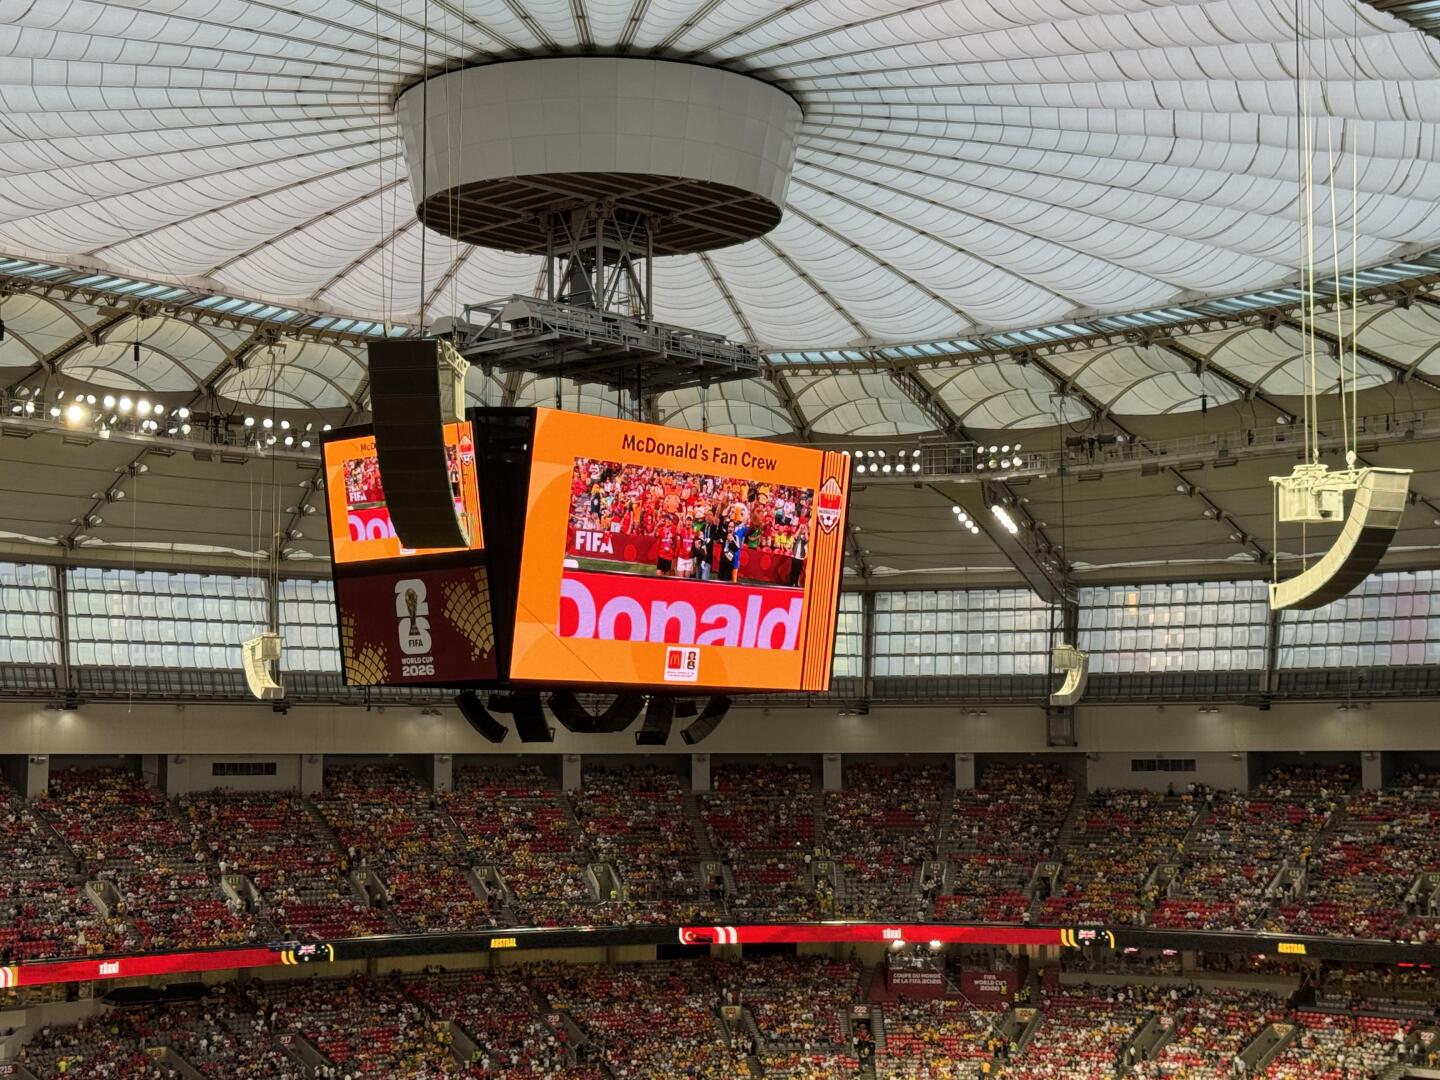
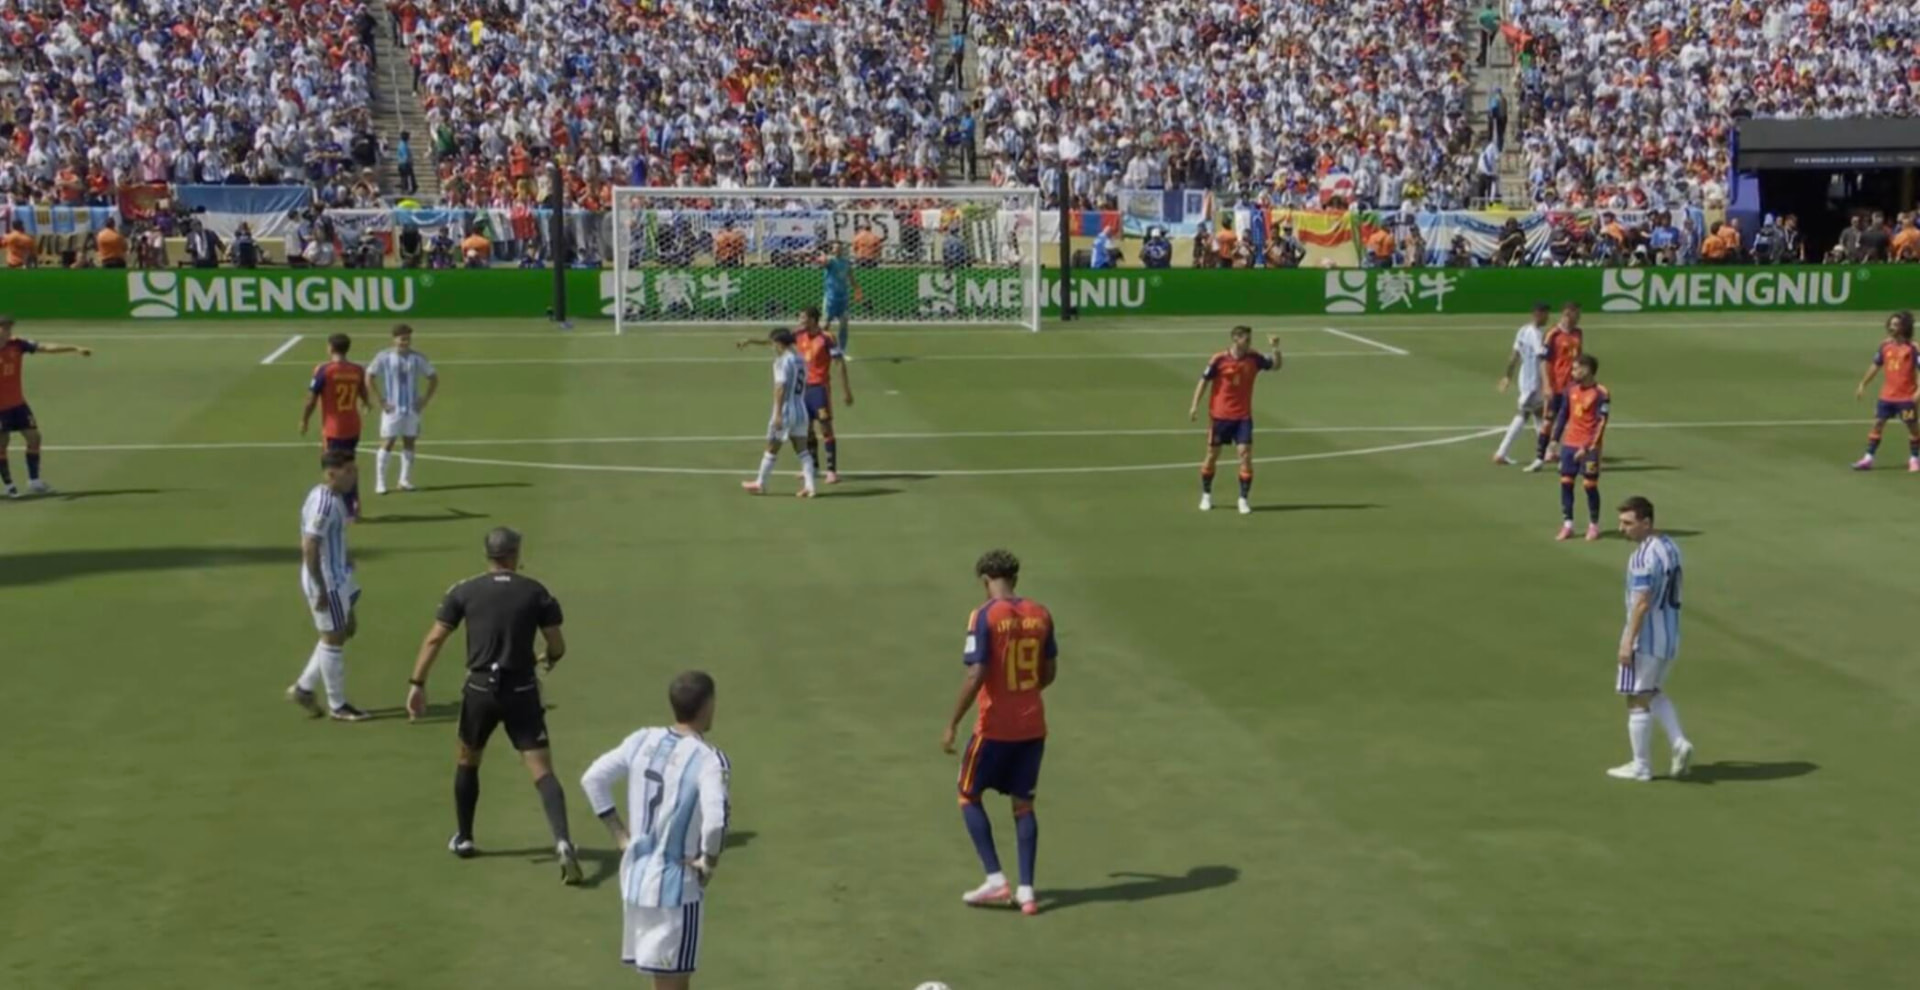
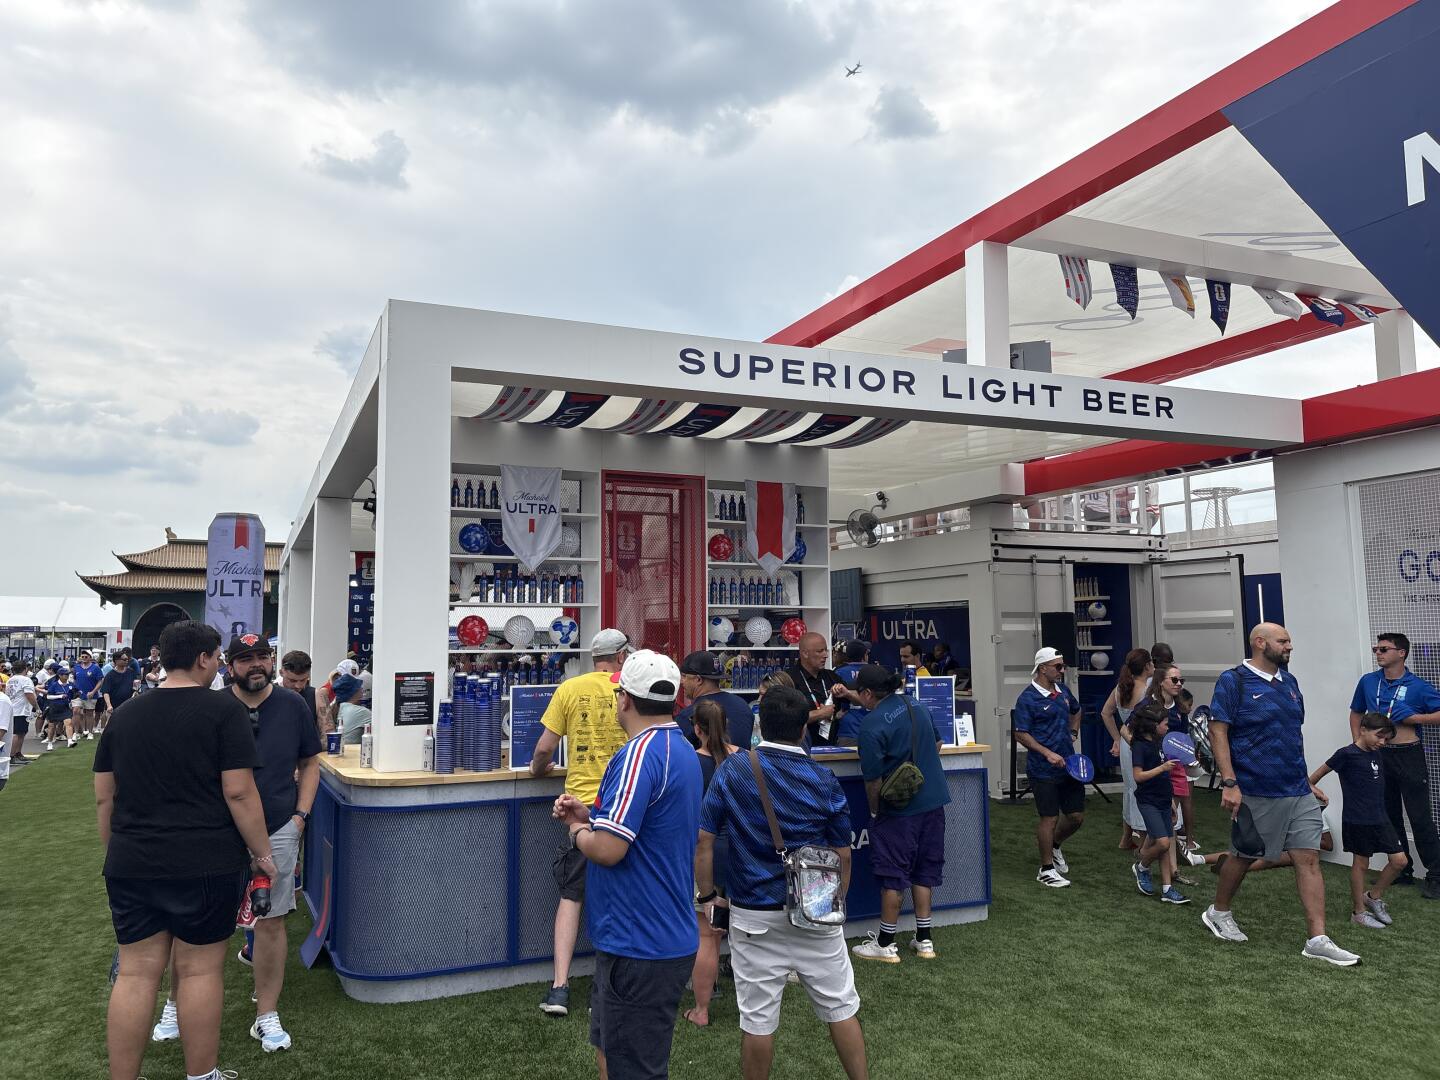
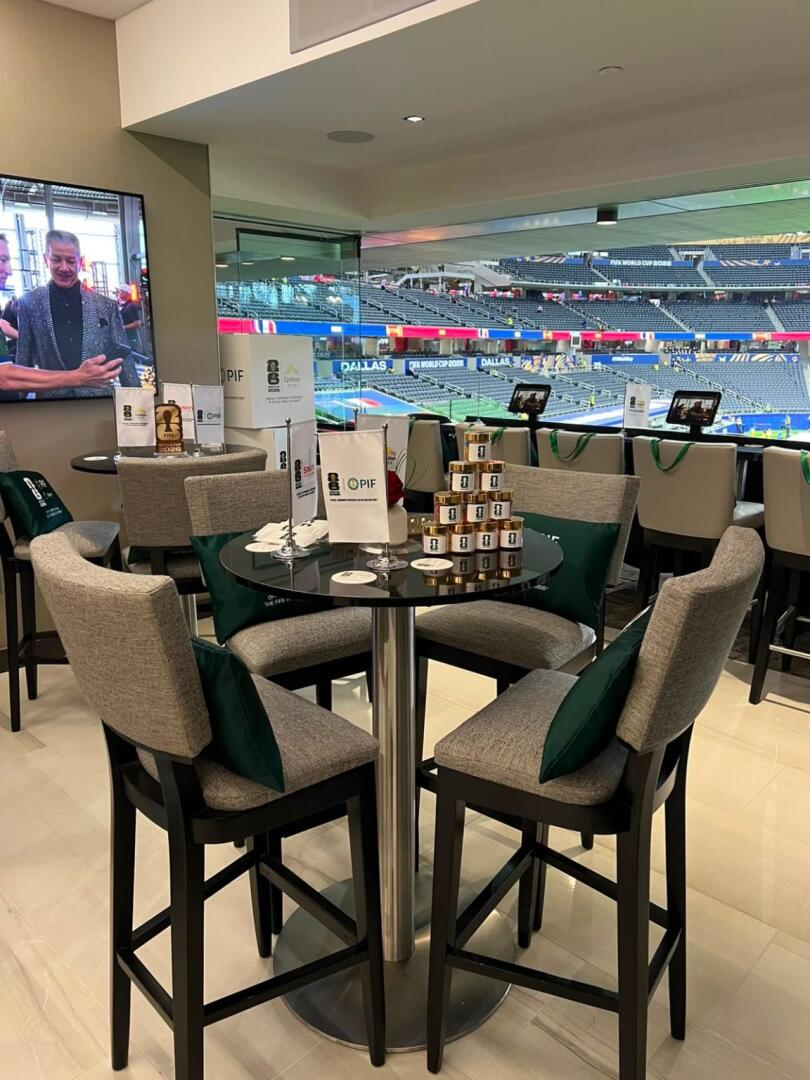
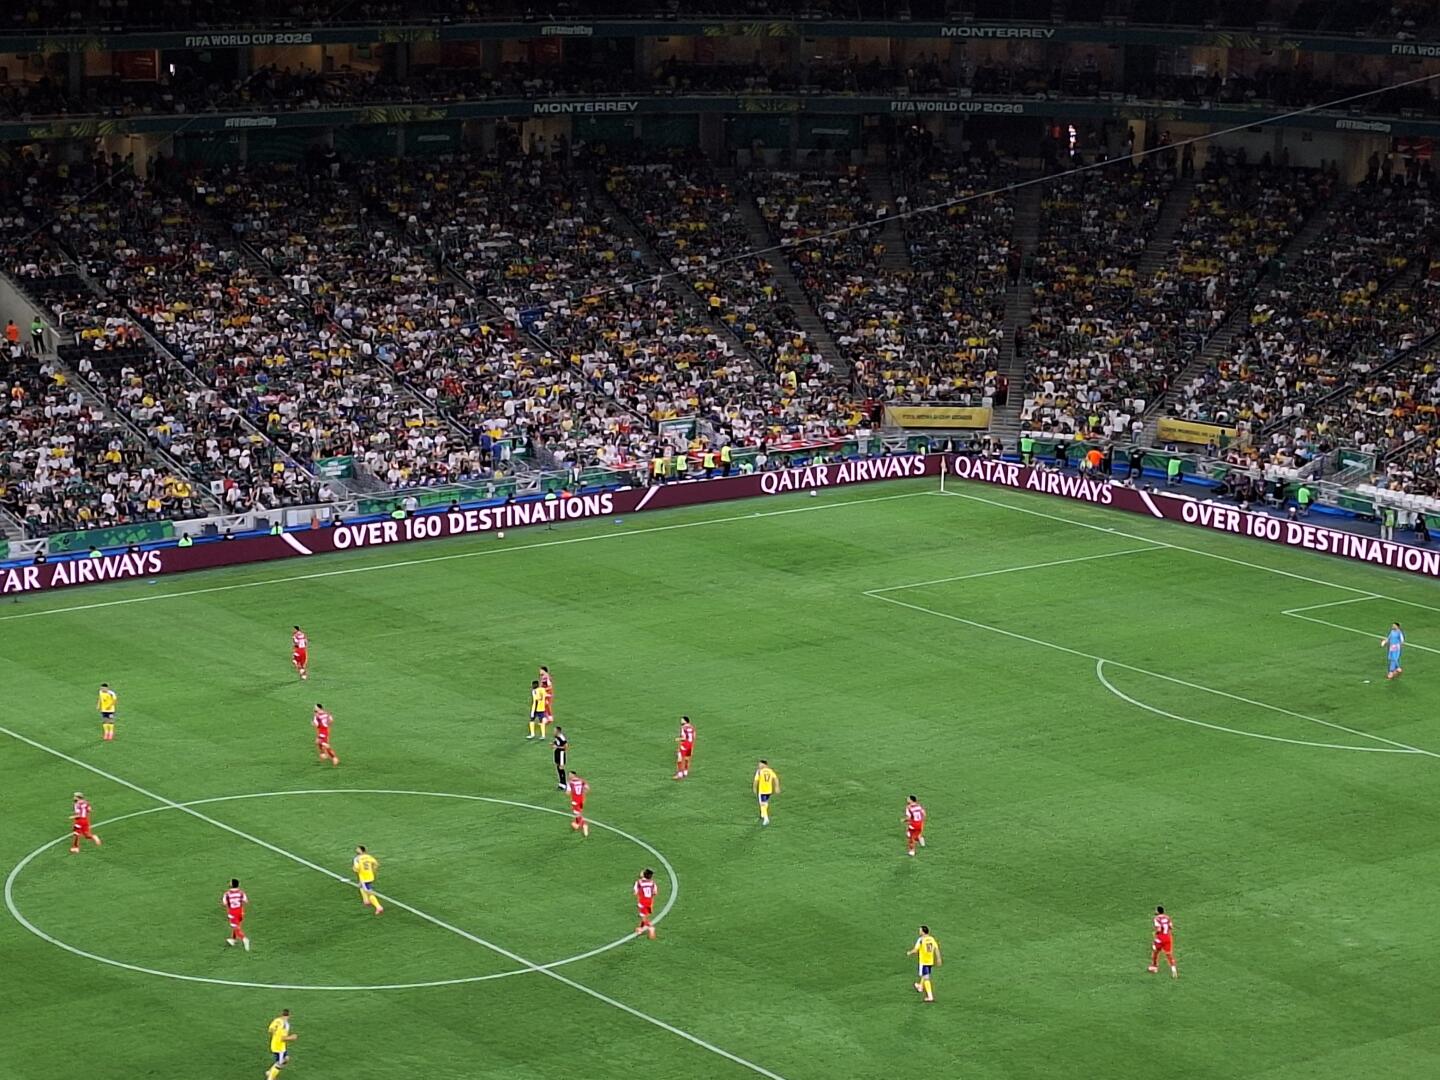
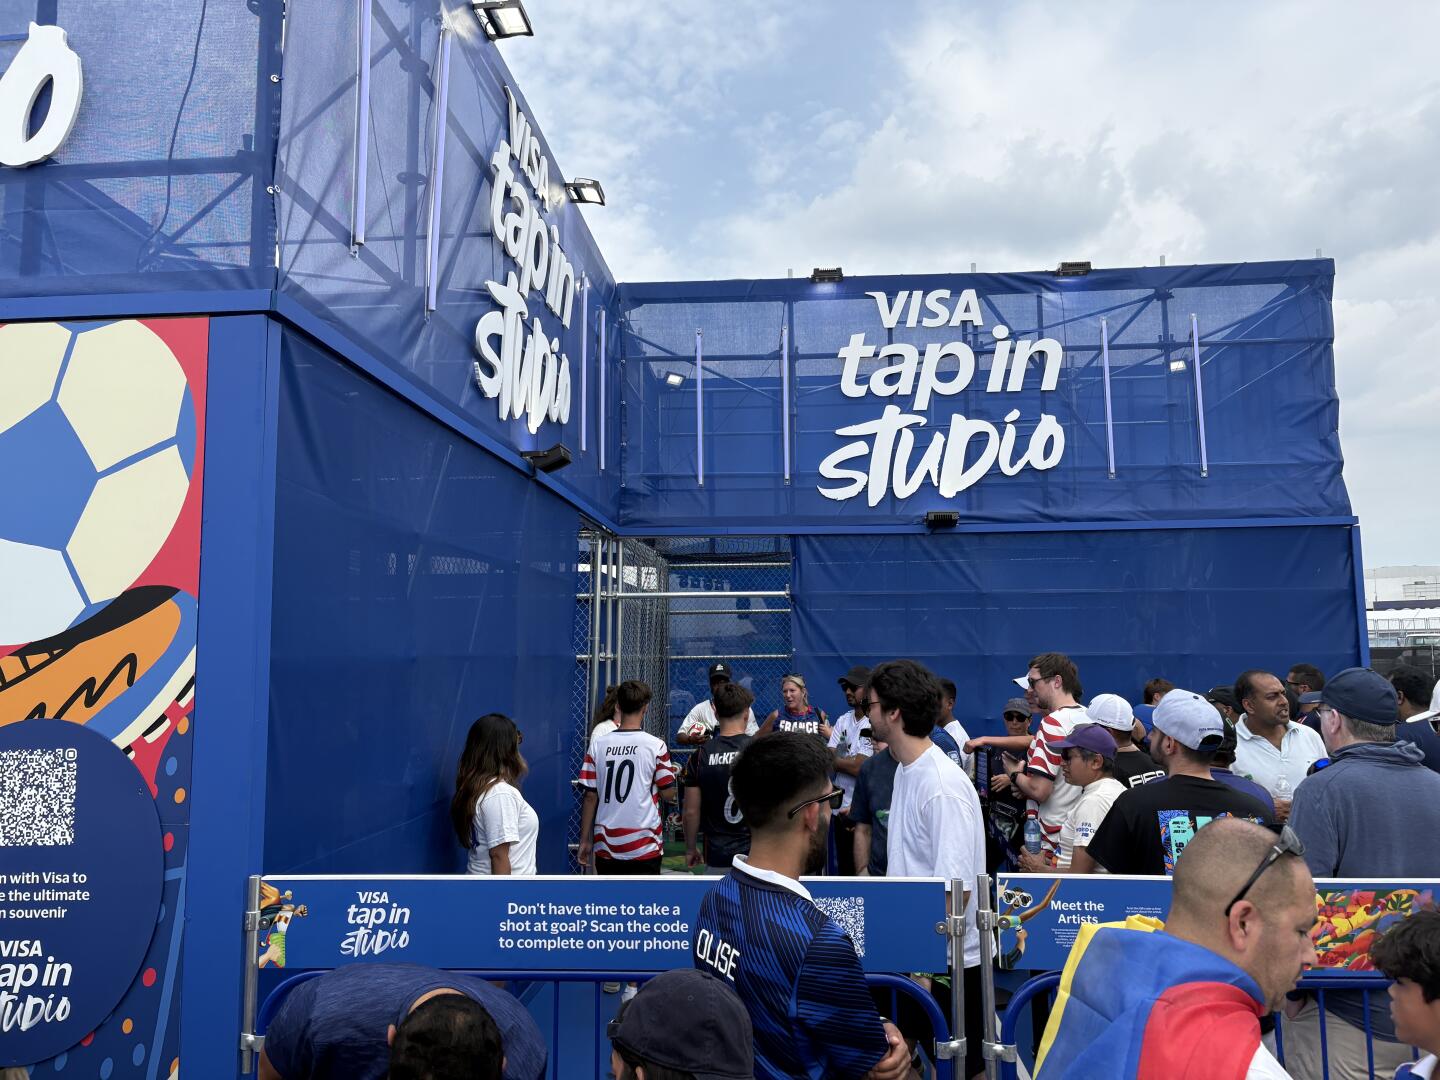
Not ranked: These are the brands behind the largest World Cup deals by estimated spend, presented without rank order.
Brand-level estimated spend available on SponsorUnited platform with SPND.
SPND available on platform →The brands behind the biggest World Cup deals are not limited to legacy FIFA partners. Prediction markets, financial services, energy, consumer electronics, telecom, food, and beverage all show up near the top — no single category dominates. Across all 35 parent brands tracked, the average commitment was $49M–$63M (rounded). Price points may vary to levels well outside this range depending on partnership level.
02 · Top spending categories
Financial and Gaming poured the most money into the tournament.
Categories tracked
22
Top category spend
$200M–$250M
Financial · 4 deals
Most active category
4 deals
Financial
Top 10 categories by estimated total spend
Financial
Deal count
4 DEALS
Gaming
3 DEALS

Beverage - Non-Alcoholic
3 DEALS

Beverage - Alcohol
2 DEALS
Consumer Electronics
2 DEALS

Transportation
2 DEALS
Food Products
2 DEALS
Consumer Products
2 DEALS

Auto
2 DEALS
Telecommunications
1 DEAL
Signage is the dominant sponsorship asset across every Top 10 spending category, capturing nearly half of revenue allocation in 9 of the 10 top-spenders — with Consumer Products the lone exception, splitting evenly between Signage and Property Rights & Exposure.
03 · Assets & rate benchmarks
Digital ads on ground level wall was the most-purchased asset across the tournament — but creative outliers such as armpit branding stole the show.
| Asset | Platform | Avg rate range | % of deals |
|---|---|---|---|
| Other Brand Exposure | $22.53M – $28.67M | 2% | |
| Interior (Premium/Exclusive) | $11.26M – $14.34M | 20% | |
| Premium Brand Exposure | $7.67M – $9.77M | 36% | |
| Interior / TV-Visible (Rotating) | $4.71M – $5.99M | 65% | |
| Event Content / Activation | $2.02M – $2.58M | 5% |
Rotating LED signage led TV-visible in-game exposure — present in 65% of deals. The premium sits with in-broadcast surfaces and press backdrops; outside the rate card, brands bought attention with placement creativity: referee underarms, referee sleeves, sideline ball holders, and the ball itself.
* Rate ranges and % of deals are directional bands around SponsorUnited's estimated average rate. Numbers can change drastically based on the level of partnership with the World Cup and the extent of the partnership across FIFA.
SPND available on platform →Creative logo placements that stood out
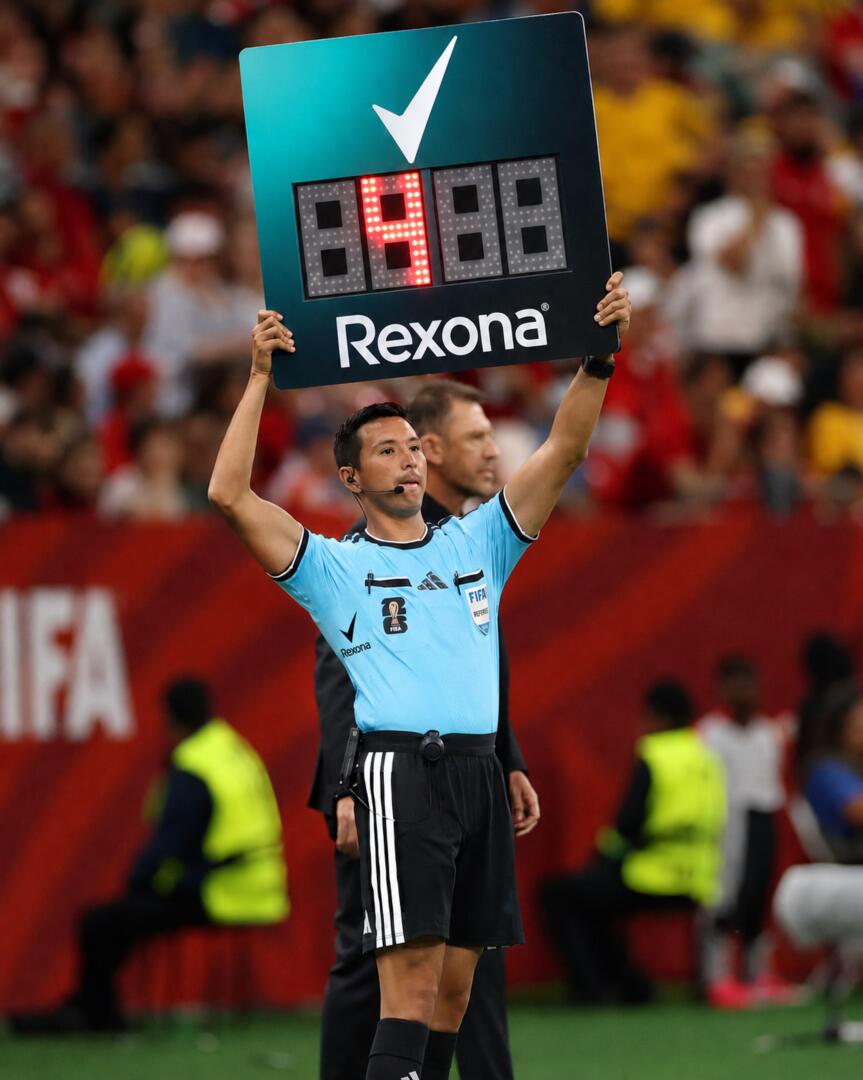
Degree / Rexona
Referee underarm branding
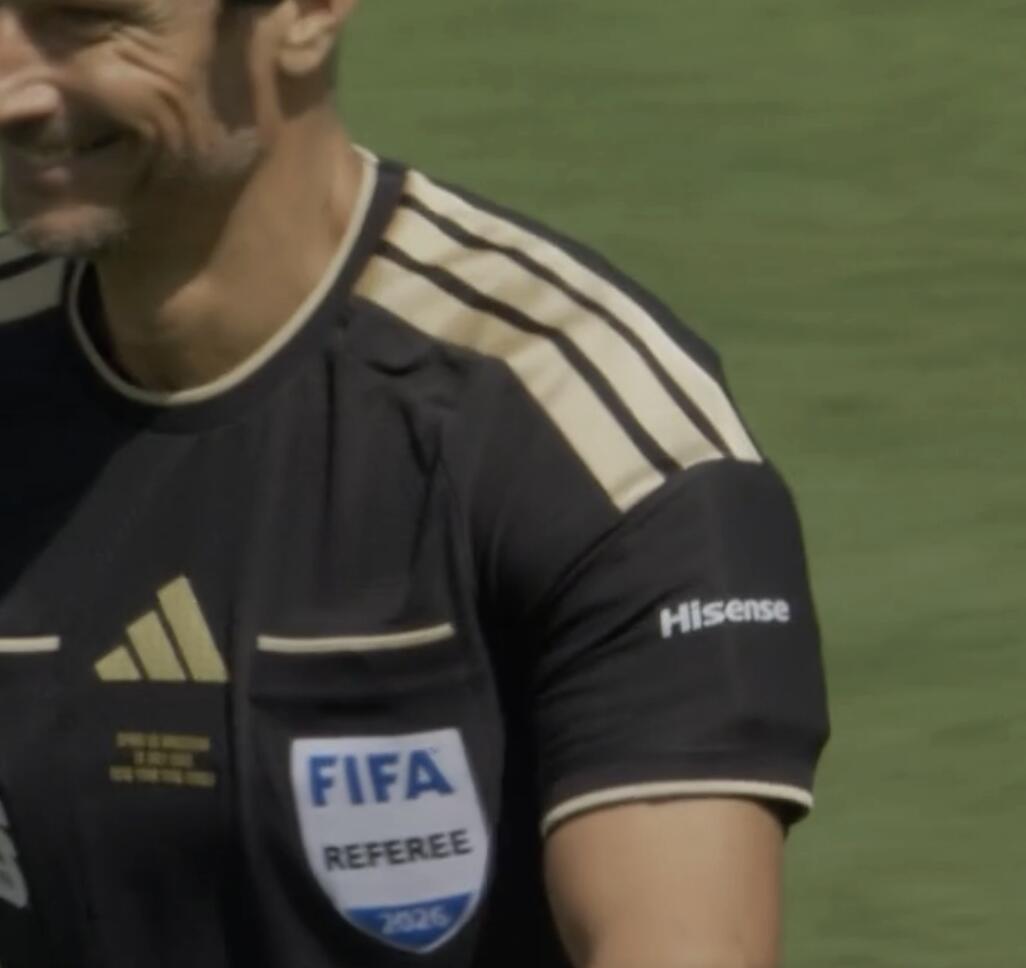
Hisense
Referee sleeve branding
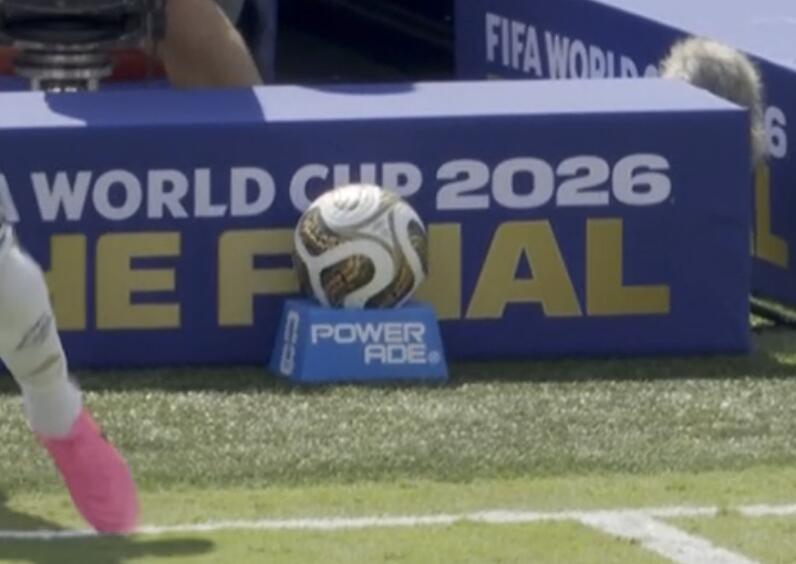
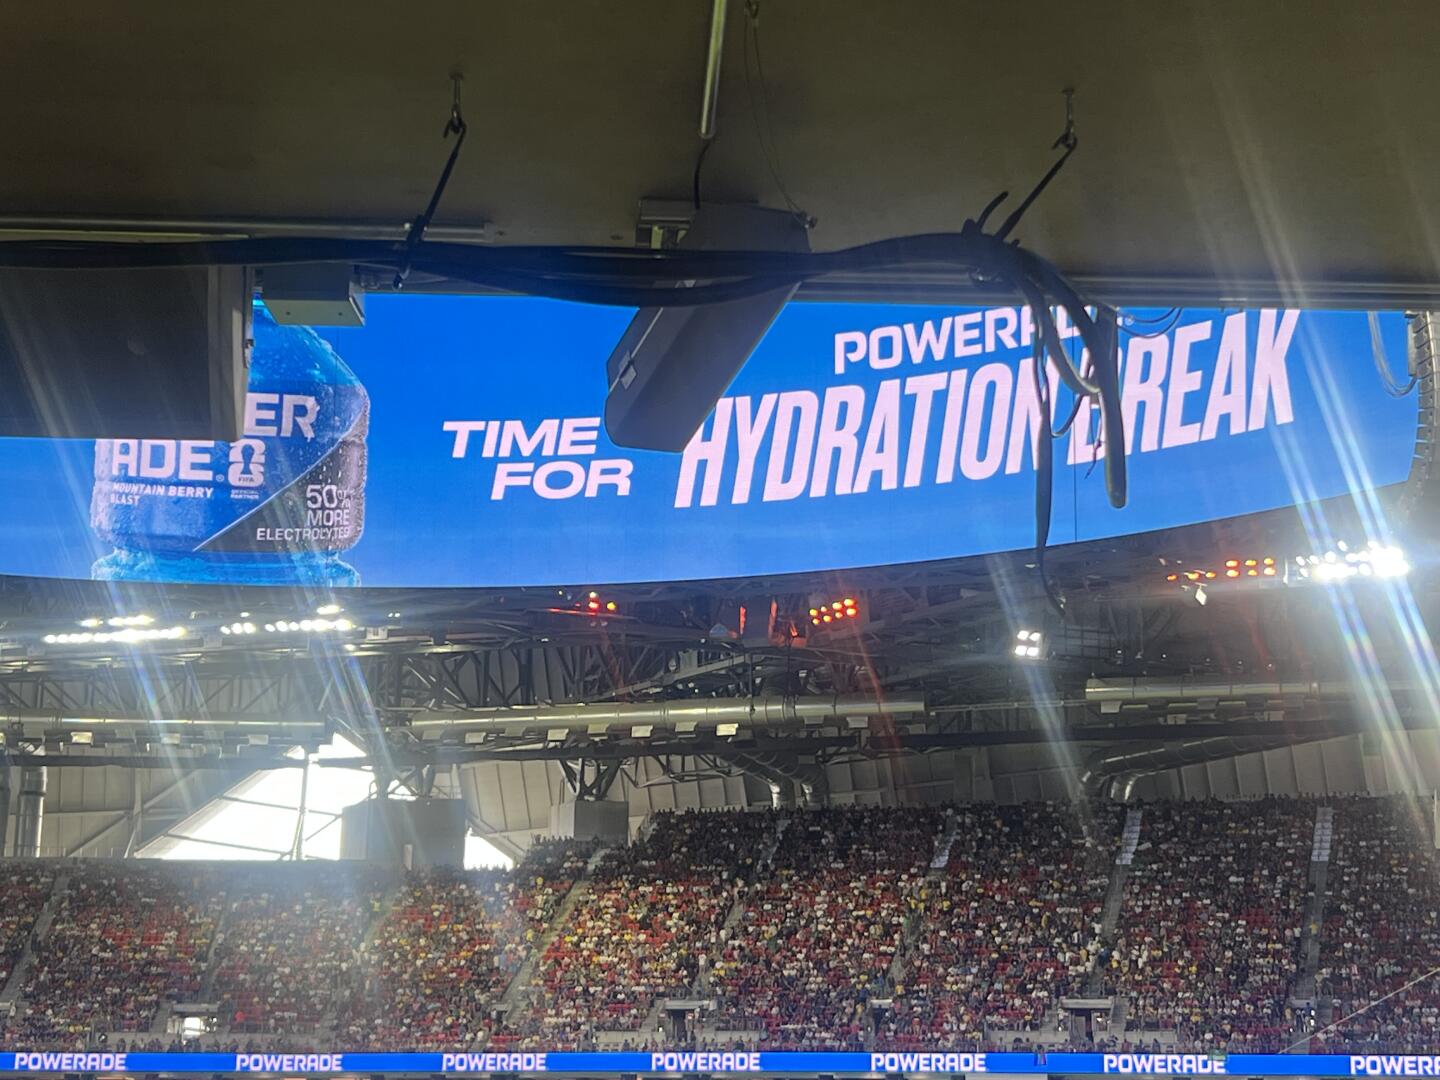
Powerade
Sideline ball holders + Hydration Break Partner
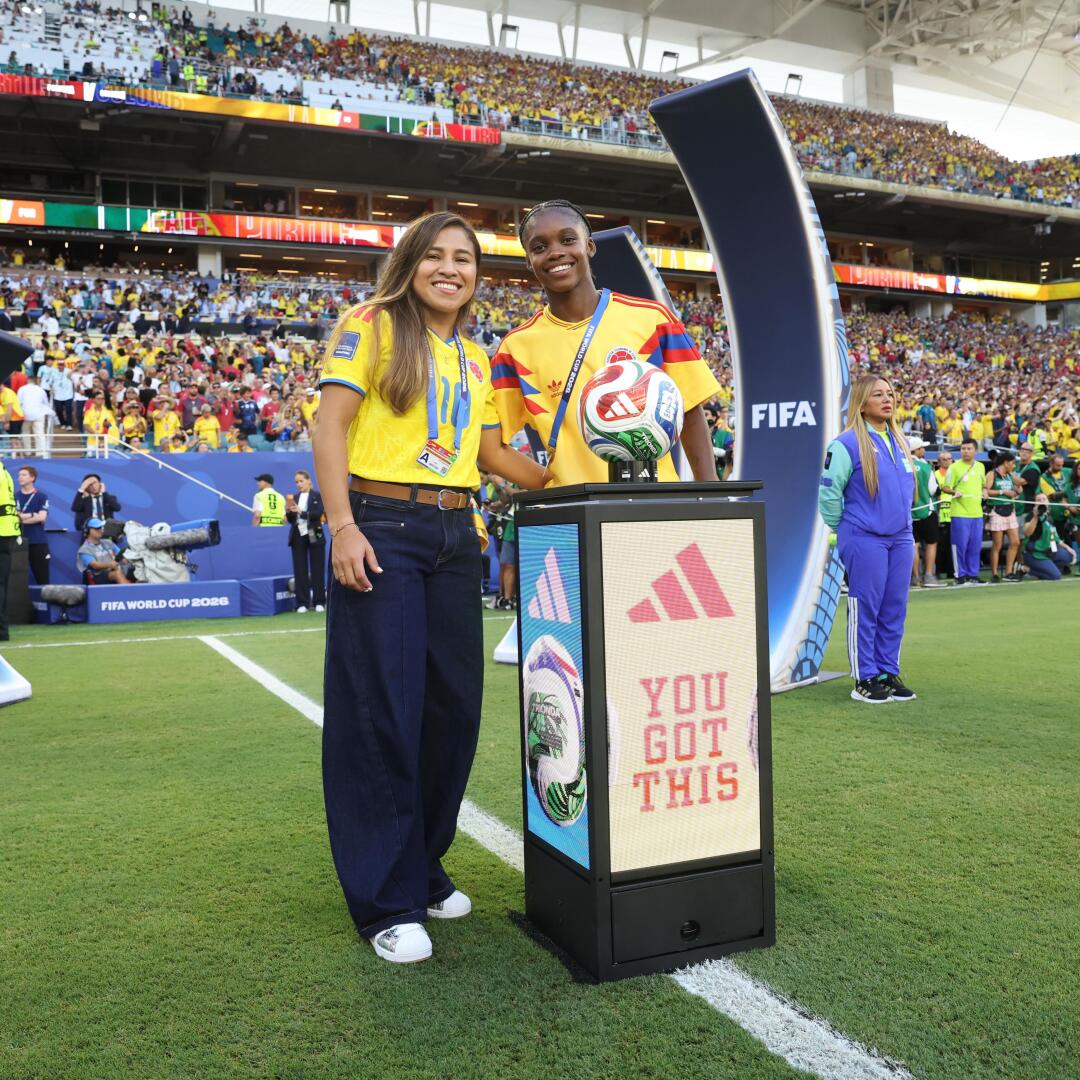
Adidas
Ball + uniforms
04 · The side door
In without a deal: the brands that found another way in
Not every brand that showed up at the 2026 World Cup signed a deal with FIFA. A few "side-door entrants" leveraged relationships with existing FIFA sponsors to get inside the tent — gaining real visibility without a direct rights agreement, and without a SPND estimate of their own.
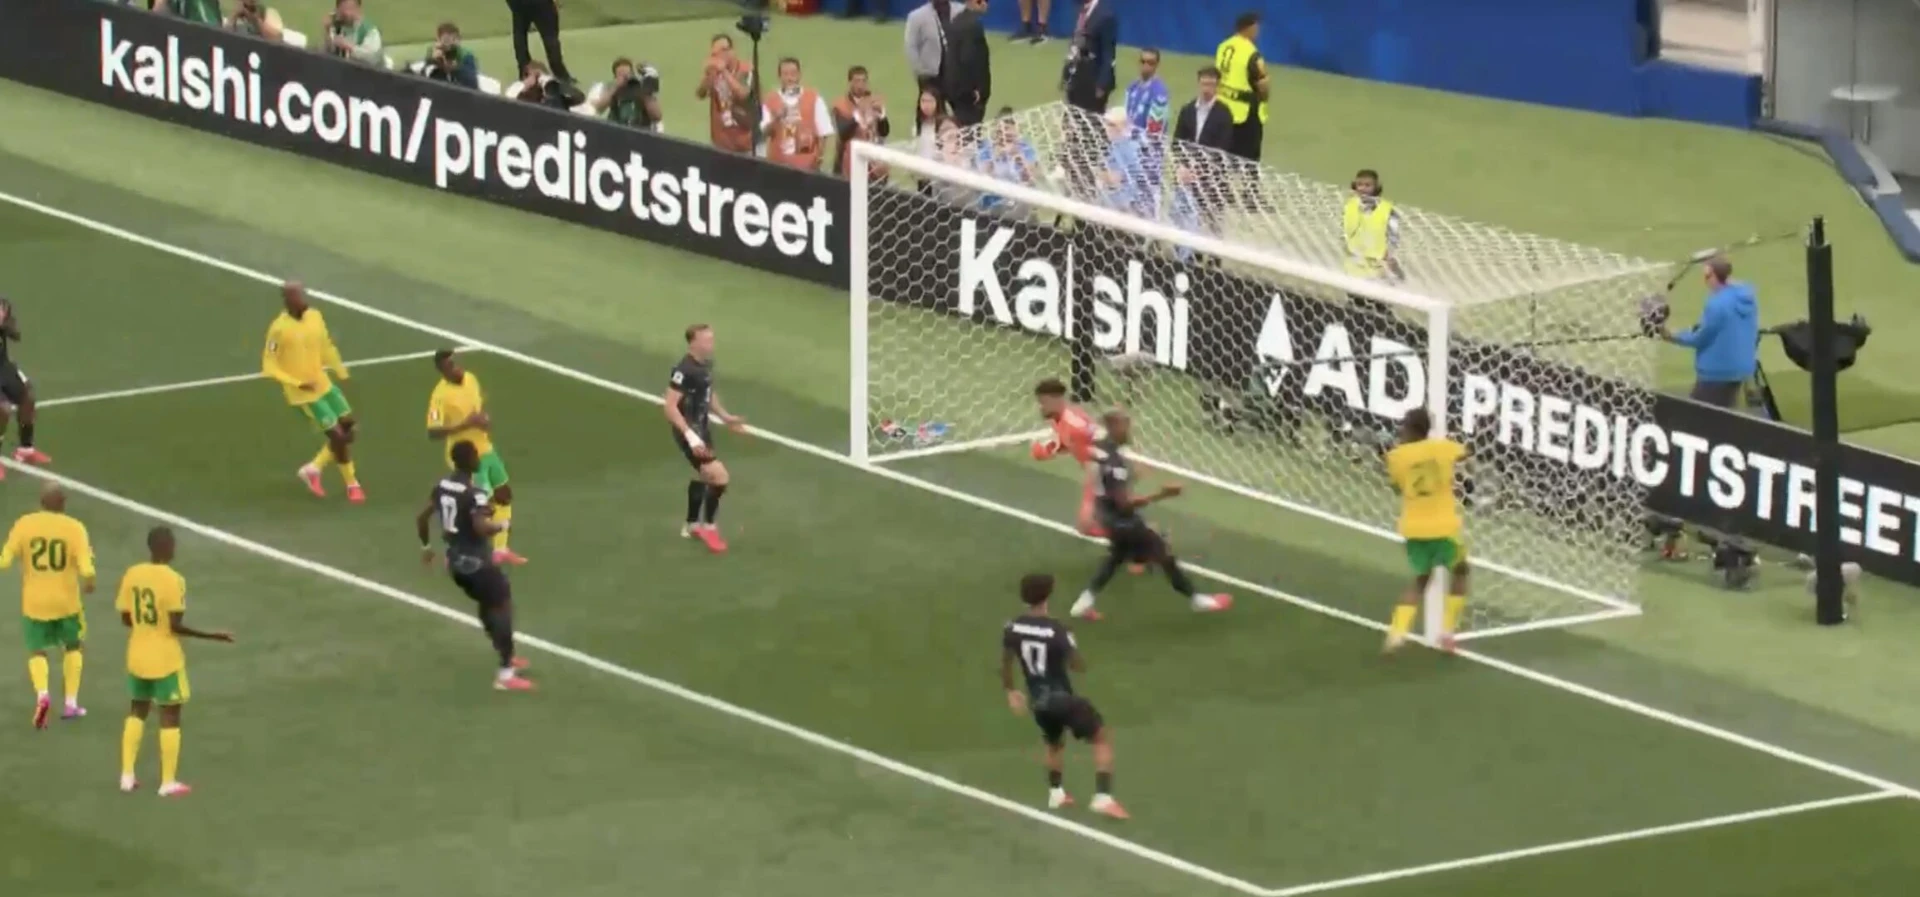
Kalshi
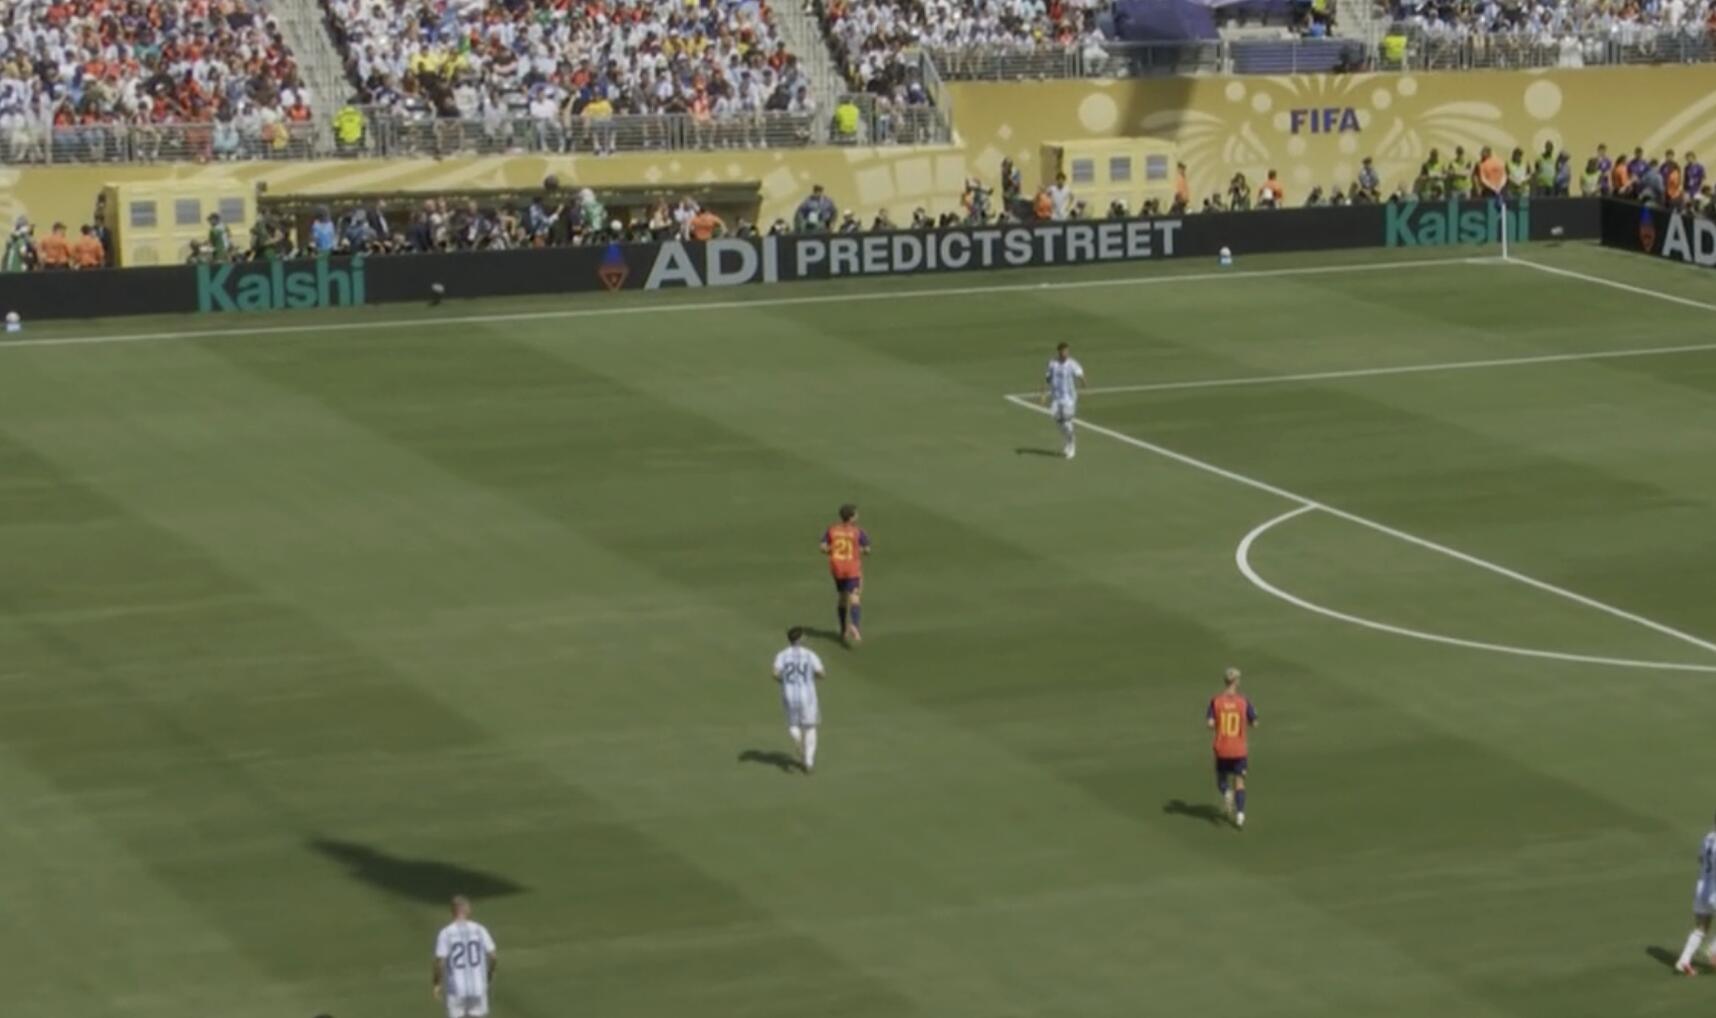
Rejected FIFA's $150M asking price for a prediction markets partner, then collaborated with official FIFA partner ADI Predict Street. Kalshi later reported $27 billion in World Cup trading volume. Kalshi is reflected as a passthrough in our system and is not represented by any SPND estimate as a result.
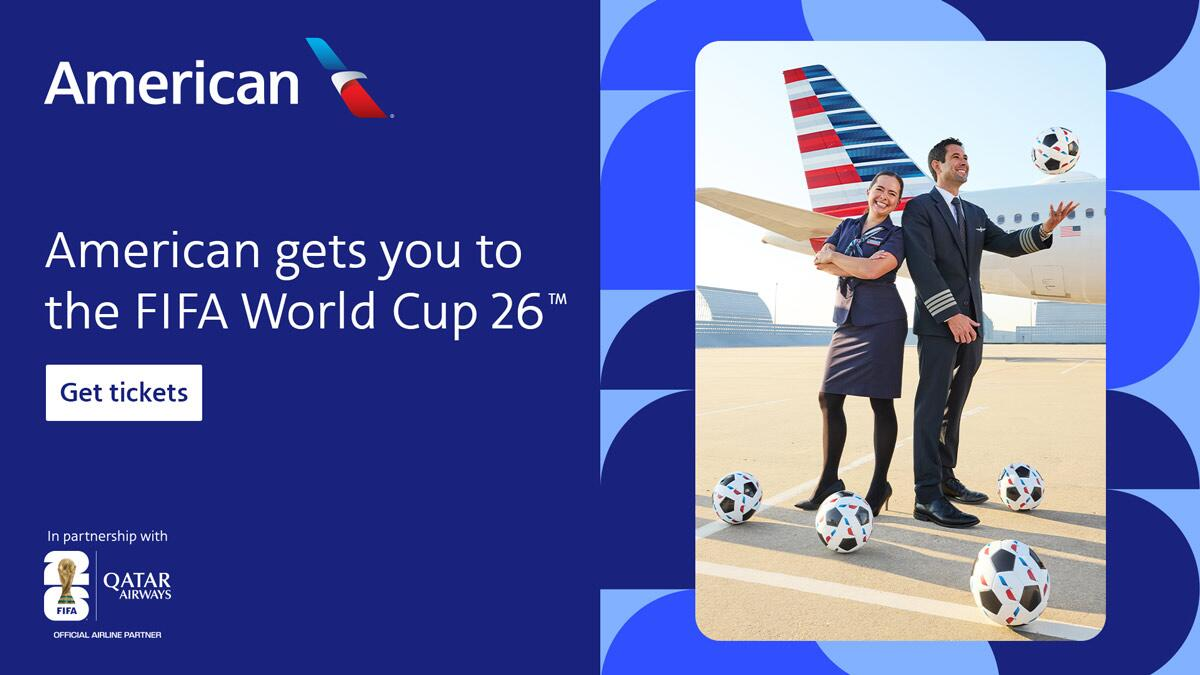
American Airlines
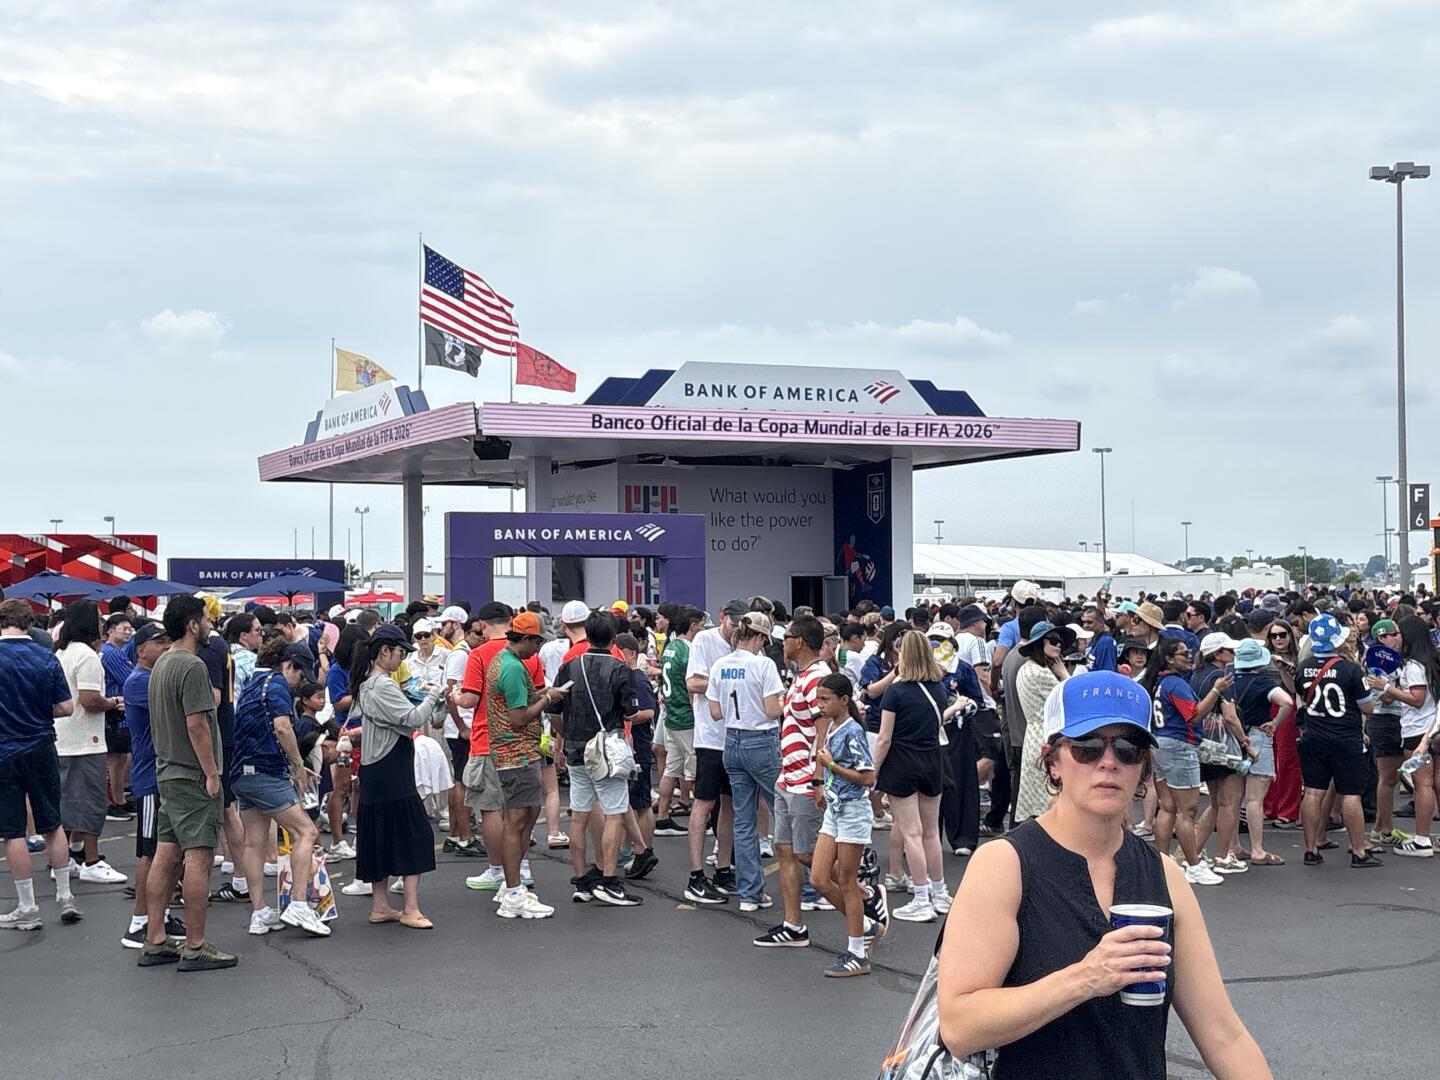
American Airlines took a targeted route in as the Official North American Airline Supplier alongside its existing U.S. Soccer partnership — skipping a premier global category sponsorship in favor of off-the-pitch fan touchpoints. “Spot the Bag” airport activations, Tim Howard ambassador creative, AAdvantage® loyalty integrations, and an Edge NYC watch party let it capture domestic travel demand across host cities without the overhead of a top-tier deal.
Methodology & data notes
How this report was built
SCOPE
This report covers brand sponsorship of the 2026 FIFA World Cup. Figures exclude potential additional spend across media, hospitality, and other FIFA events. A brand counts if it held an active World Cup sponsorship at any point in the tournament cycle.
ESTIMATED PRICING "SPND"
All dollar figures are estimated using SponsorUnited's proprietary SPND™ pricing model — not reported or actual valuations — unless otherwise noted. Brand estimated spend is published as ranges rather than point estimates.
BRANDS & CATEGORIES
35 parent brands across 22 categories are included. Category totals sum estimated deal prices for every brand in that category; average and median are calculated across the deals in that category, so a small number of very large deals can pull the average well above the median.
ASSET RATES
145 assets were benchmarked. "% of deals including asset" is the share of tracked World Cup deals containing that asset. Published rate ranges are directional bands around the estimated average rate for the asset; exact medians, averages, and cost-allocation percentages are withheld.
REDACTED FIGURES
Public versions of this report show the top-ranked brands and asset rates only. Remaining ranks are marked withheld; the complete brand, category, and asset datasets are available to SponsorUnited clients.
SPONSORSHIP TIERS
FIFA sponsorships sit in tiers, and the tier shapes what a deal really buys. FIFA sponsorships are typically categorized into tiers: FIFA Partner, FIFA World Cup Sponsor, and Regional/Market-Specific Sponsors (which may also cover other tournaments). Rights, visibility, and cost differ meaningfully by tier.
PARENT VS. CHILD BRANDS
Deal counts are labeled at the level the deal was signed. A parent company may appear through a child brand in a different category — PepsiCo, for example, appears via Frito-Lay under Snacks rather than alongside Coca-Cola in Beverage - Non-Alcoholic.
PASSTHROUGH BRANDS
Brands that gained World Cup visibility through another sponsor's rights are treated as passthroughs and carry no SPND estimate of their own. Kalshi, which activated through official FIFA partner ADI Predict Street, is one such case.
DIRECTIONAL DATA
Estimates reflect the SponsorUnited platform at time of publication and may shift as deals are added or updated.